Hawaii Flowers & Nursery Products

Here is the PDF file for the Hawaii Flowers & Nursery Products report.

flower091307.pdf

Please visit the website for more information: http://www.nass.usda.gov/hi/

————————————————————-
Contact Information:
Mark E. Hudson, Director
USDA NASS Hawaii Field Office
1421 South King Street
Honolulu, HI 96814-2512

Office: (808) 973-9588 / (800) 804-9514
Fax: (808) 973-2909
————————————————————-

HAWAII FLOWERS & NURSERY PRODUCTS” reports are available on our website and also PRINTED annually. Subscriptions for PRINTED copies are free to those persons who report agricultural data to NASS (upon request) and available for $2 per year to all others.

HAWAII FLOWERS & NURSERY PRODUCTS Annual Summary
Release: September 10, 2007

2006 FLORICULTURE AND NURSERY PRODUCTS NEAR RECORD

Hawaii?s floriculture and nursery products is estimated at $100.7 million for 2006. This is near the previous year?s record high and continues as the top contributor to diversified agriculture according to the USDA, NASS, Hawaii Field Office. Some commodity groups experienced increases while others had decreases in 2006. Cut flowers totaled $14.1 million, up 1 percent. Cut and potted orchids were valued at $22.2 million, nearly unchanged from last year. Lei flowers pegged at $3.5 million was 6 percent lower. Foliage sales were 7 percent less, registering at $18.1 million. Potted flowering plants were 1 percent above 2005 and valued at $6.4 million. Landscape plants were estimated at $20.9 million, almost unchanged from last year. Plant rentals increased 4 percent and totaled $5.1 million. Other nursery products jumped 14 percent, registering $5.8 million. Bedding and garden plants wholesale value, at $3.3 million, was 11 percent higher than 2005.

STATE SUMMARY

COUNTY RANKINGS:
Hawaii County, with $51.9 million in sales, ranked number one in 2006. Honolulu farmers registered sales at $33.5 million, 3 percent more than 2005. Maui County sales totaled $12.3 million, 3 percent above last year. Kauai sales, pegged at $2.9 million, were 8 percent below 2005.

COUNTY SUMMARIES

HAWAII COUNTY LEADS IN SALES
Hawaii County growers of flowers and nursery products accounted for 52 percent of the State?s total wholesale value of flowers and nursery products in 2006. Hawaii County?s 410 growers rang up sales of $51.9 million, 3 percent less than the $53.4 million in 2005. Honolulu?s 250 producers accounted for 33 percent of the State?s total wholesale value of flowers and nursery products. Honolulu farmers reported sales of $33.5 million, 3 percent above 2005. Maui County?s 195 producers generated $12.3 million in sales, 3 percent more than a year ago. Kauai?s 75 producers registered $2.9 million in sales, 8 percent less than 2005.

OUT-OF-STATE SALES

OUT-OF-STATE SALES TOTALED $49.0 MILLION

The value of out-of-State sales of flowers and nursery products (including wholesale and retail sales) during 2006 was estimated at $49.0 million. Values in this table are not comparable to values shown in the majority of other tables throughout this release. The value of out-of-State sales represents the dollar received at the point the commodity leaves the State. Thus, the product contains retail and wholesale sales and may include multiple transactions by the time it leaves the State.

Potted foliage, valued at $11.6 million, remained the number one floriculture and nursery product exported. Other potted orchids followed second with $9.3 million in value. Cut anthurium exports contributed $7.1 million, up 14 percent from 2005. Potted dendrobium orchids ranked fourth in out-of-State sales with $3.8 million, declining 13 percent from 2005.

DENDROBIUM ORCHID SALES DOWN 10 PERCENT
In 2006, dendrobium orchid sales were valued at $8.8 million, 10 percent lower than 2005. Potted in bud/bloom contributed $5.7 million, declining 3 percent from last year. Cut sprays registered $2.5 million in sales, down 19 percent from the previous year. Sales of individual blossoms fell 10 percent to $532,000.

DENDROBIUM PRODUCTION AREA 9 PERCENT LOWER
The combined production area for dendrobium cut sprays and in bud/bloom pots totaled 5.2 million square feet, 9 percent lower than 2005. Production area reported by growers includes newly planted, as well as established acreage; thus, year-to-year yield comparisons calculated using area and sales may be misleading.

Area utilized for cut sprays totaled 2.8 million square feet, 16 percent below 2005. Production area for potted in bud/bloom totaled 2.4 million square feet, increasing 2 percent from the previous year.

HAWAII MONTHLY LIVESTOCK REVIEW

Here is the PDF file for the Hawaii Monthly Livestock Review Report.

lvstk091307.pdf

Please visit the website for more information: http://www.nass.usda.gov/hi/

————————————————————-
Contact Information:
Mark E. Hudson, Director
USDA NASS Hawaii Field Office
1421 South King Street
Honolulu, HI 96814-2512

Office: (808) 973-9588 / (800) 804-9514
Fax: (808) 973-2909
————————————————————-

HAWAII MONTHLY LIVESTOCK REVIEW” reports are available on our website and also PRINTED monthly. Subscriptions for PRINTED copies are free to those persons who report agricultural data to NASS (upon request) and available for $4 per year to all others.

Hawaii Monthly Livestock Review

National Agricultural Statistics Service

September 13, 2007

In Cooperation with the Hawaii Department of Agriculture
Hawaii Field Office ? 1428 South King Street ? Honolulu, HI 96814-2512 ? 1-(800)-804-9514 ? www.nass.usda.gov

July Egg Production Down 19 Percent From A Year Ago
Hawaii egg production totaled 7.0 million (19,444 cases) in July 2007, down 19 percent from July 2006. The average number of layers on hand during July 2007 was estimated at 369,000, up fractionally from June 2007 and down 16 percent from July 2006. The average rate of lay during July 2007 was 1,897 per 100 layers (61.2 percent rate of lay), down 3 percent from July 2006.

Total Cattle Marketings and Exports

Cattle Marketings Up 31 Percent From 2006
Total cattle marketings for July 2007 is estimated at 3,800 head, up 31 percent from July 2006. Cumulative cattle marketings for the first seven months of 2007 totaled 31,700 head, down 3 percent from the same period a year ago.

Exports up 40 percent in July compared to year ago
Exports of steers and heifers totaled 2,800 head in July 2007, up 40 percent from a year ago. Exports of steers totaled 1,400 head during July 2007, up 17 percent compared to a year ago. Total export of heifers also increased in July 2007 compared to a year ago at 1,400 head, a 75 percent increase. Cumulative exports of steers and heifers through July 2007 totaled 25,300 head, down 5 percent from the same period a year ago. Cumulative exports of steers for 2007 stands at 14,700 head, down 5 percent from 2006. Exports of heifers were also down 5 percent for the first seven months of 2007 at 10,600 head. Exports of other classes of cattle were not included.

Average live weight up 2 percent
The average live weight of steers and heifers exported from Hawaii in July 2007 was 428 pounds, up 2 percent from July 2006?s average live weight of 420 pounds.

Cattle and Hogs Commercial Slaughter

Commercial Beef Production Down 4 Percent
Hawaii commercial beef production (local slaughter) during July 2007 totaled 516,000 pounds, down 4 percent from July 2006. Cumulative beef production (local slaughter) through July 2007 totaled 3.7 million pounds, up 5 percent from a year ago. Commercial kill totaled 900 head in July, unchanged from July 2006. Average live weight per head was 1,023 pounds in July 2007, down 4 percent from the average live weight per head in July 2006. Commercial Pork Production Down 10 Percent
Hawaii commercial pork production during July 2007 totaled 291,000 pounds, down 10 percent from July 2006. Cumulative pork production for the first seven months of 2007 totaled 2.0 million pounds, down 10 percent from a year ago. Total hog kill was 1,800 head in July 2007, down 5 percent from a year ago. Average live weight per head was 211 pounds in July 2007, down 9 percent from the 232-pound average a year ago.

Milk Cows and Milk Production

July Milk Production Down 48 Percent From Year Ago
Hawaii?s dairy cows produced 2.6 million pounds of milk in July 2007, down 48 percent from a year ago. Cumulative milk production for the first seven months of 2007 totaled 24.3 million pounds, down 31 percent from the same period in 2006.

July?s Cow Herd Down 37 Percent From Year Ago
Hawaii?s cow herd, both dry and milking, numbered 2,700 head in July 2007, unchanged from June 2007 and down 37 percent from July 2006.

Milk Per Cow Decreases
Average milk per cow is estimated at 1,000 pounds for July 2007, down 14 percent from last July?s average of 1,165 pounds per cow.

Average Farm Prices

Most July Livestock Prices Above Year-ago Averages

Steers and heifers
The average dress weight farm price for steers and heifers is estimated at 99.5 cents per pound for July 2007, up half-a-cent from June and 1.5 cents per pound higher than a year ago.

Cows
The average dress weight farm price for cows is estimated at 55.0 cents per pound in July 2007, unchanged from June. Compared to a year ago, the average dress weight farm price for cows was 3.0 cents per pound higher in July 2007.

Market hogs
The average dress weight farm price for market hogs is estimated at $1.25 per pound for July 2007, 8 cents per pound higher than June 2007. Compared to a year ago, the dressed weight for market hogs was down 5.0 cents per pound this July.

Milk
The average farm price for milk was $29.90 per hundredweight during July 2007, up $2.20 from June 2007. Compared to a year ago, the July 2007 average farm price for milk was $5.00 per hundredweight higher.

Eggs
The average farm price for a dozen eggs was $1.05 in July 2007, up 1 percent from June 2007. Compared to a year ago, the average farm price for a dozen eggs was up 8 percent in July.

U.S. Livestock Roundup

NASS

Commercial red meat production for the United States totaled 3.94 billion pounds in July, up 4 percent from the 3.79 billion pounds produced in July 2006.

Beef production, at 2.26 billion pounds, was 2 percent above the previous year. Cattle slaughter totaled 2.90 million head, up 2 percent from July 2006. The average live weight was down 4 pounds from the previous year, at 1,269 pounds.

Veal production totaled 10.7 million pounds, 5 percent below July a year ago. Calf slaughter totaled 62,600 head, up 8 percent from July 2006. The average live weight was down 36 pounds from last year, at 289 pounds.

Pork production totaled 1.66 billion pounds, up 7 percent from the previous year. Hog kill totaled 8.40 million head, up 7 percent from July 2006. The average live weight was up 1 pound from the previous year, at 264 pounds.

Lamb and mutton production, at 13.5 million pounds, was up 2 percent from July 2006. Sheep slaughter totaled 204,700 head, 1 percent above last year. The average live weight was 131 pounds, up 1 pound from July a year ago.

U.S. egg production totaled 7.57 billion during July 2007, down 1 percent from last year. Production included 6.44 billion table eggs, and 1.14 billion hatching eggs, of which 1.07 billion were broiler-type and 66 million were egg-type. The total number of layers during July 2007 averaged 339 million, down 1 percent from last year. July egg production per 100 layers was 2,234 eggs, down slightly from July 2006.

All layers in the U.S. on August 1, 2007 totaled 340 million, down slightly from last year. The 340 million layers consisted of 281 million layers producing table or market type eggs, 56.2 million layers producing broilertype hatching eggs, and 2.72 million layers producing egg-type hatching eggs. Rate of lay per day on August 1, 2007, averaged 72.1 eggs per 100 layers, up 1 percent from August 1, 2006.

Excerpts from Livestock Slaughter (August 24, 2007) and Chickens and Eggs (August 21, 2007) releases.

ERS – ECONOMIC RESEARCH SERVICE

Cattle/Beef: NASS? Cattle report showed virtually all July 1, 2007 inventories down from July 1, 2006. The report indicates that cattle inventory growth has stalled, at best, or peaked, at worst, for the cattle cycle that first expanded in 2005, up from a cyclical low cattle and calf inventory of 103.6 million head on July 1, 2004 (including a low total cow inventory of 42.4 million head). The last cycle with a short expansion phase occurred during the cycle that began from a low point on January 1, 1979, peaked in 1982 after only 3 years of cattle inventory expansion, and ended at a low point in 1990 after 8 years of liquidation. As a result, beef production could be below 26 billion pounds for 2008 and 2009, which would be slightly below 2007 production, and will depend on average dressed weights and breeding heifer retention.

Hogs and Pork: Third-quarter commercial pork production is expected to be almost 5.3 billion pounds, about 3.2 percent above third quarter last year. Thirdquarter prices of live equivalent 51-52 percent lean hogs are forecast to range between $50 and $52 per hundredweight (cwt). Pork exports in the first half of 2007 were 4 percent lower than a year ago.

Dairy: Global demand for dairy products, especially nonfat dry milk, butter, and whey, will likely keep prices high this year and next despite increased domestic production in 2008.

Poultry: After falling in the first and second quarters, broiler meat production is expected to increase on a year-over-year basis in the second half of 2007. Prices for broiler products are expected to moderate as production increases. Turkey meat production continues to grow, but strong domestic demand and exports have kept stocks low and prices above those of the previous year.

Sheep and Lamb: The USDA Sheep and Goats report released on July 20, 2007 indicated a decline in inventories. On July 1, 2007, the U.S. sheep and lamb inventory totaled 7.73 million head, down slightly from 2006, but still about 1 percent above the July 1, 2004 bottom. Slight inventory reductions were seen in all of the major categories: breeding sheep, market sheep, and replacement lambs. Heavier-than-normal liquidation continues to take place in Texas and New Mexico, the region hit by severe drought in 2006. Despite these declines, the 2007 lamb crop showed year-over-year increases.

Excerpt from Livestock, Dairy, & Poultry Outlook/LDP-M- 158/August 20, 2007 Economic Research Service, USDA.

Hawaii Papayas

Here is the PDF file for the Hawaii Papayas Report.

papaya091307.pdf

Please visit the website for more information: http://www.nass.usda.gov/hi/

————————————————————-
Contact Information:
Mark E. Hudson, Director
USDA NASS Hawaii Field Office
1421 South King Street
Honolulu, HI 96814-2512

Office: (808) 973-9588 / (800) 804-9514
Fax: (808) 973-2909
————————————————————-

HAWAII PAPAYAS” reports are available on our website and also PRINTED monthly. Subscriptions for PRINTED copies are free to those persons who report agricultural data to NASS (upon request) and available for $4 per year to all others.

JULY FRESH PAPAYA HIGHER

Hawaii fresh papaya utilization is estimated at 2.4 million pounds for July 2007, up 16 percent from last month and 40 percent higher than the same month a year ago. Year-to-date sales for the first seven months of 2007 posted 15.4 million pounds, 5 percent above the comparable period in 2006.

Warm summer weather continued in July, encouraging flowering and fruit set. Tropical Depression Cosme and a weak shear line brought welcomed showers to the State. Normal farming activities were underway. Harvesting was steady. Growers were preparing fallowed fields for new plantings. Wild pig damage and Papaya Ringspot Virus were still affecting some orchards.

Papaya growers are expected to receive an estimated 47.0 cents per pound for fresh fruit in July, 10 percent (5.0 cents) lower than June, but unchanged from a year ago.

2006 Papaya Output Down

In 2006, papaya output totaled 28.7 million pounds, down 13 percent from 2005 and falling for the fifth consecutive year. Weather for 2006 had a mixture of wet and dry conditions. Continuous rain fell during mid-February until early April causing soil erosion, flooding, disease outbreaks, and fruit and tree losses in orchards across the State. It also delayed normal field routines including planting schedules.

The biotechnology variety Rainbow made up 58 percent of total acres in 2006, up 9 percent from 2005. Rainbow is resistant to Papaya Ringspot Virus (PRV), a virus that devastated the Hawaii papaya industry from 1993 to 1999. The Kapoho variety was the standard for the papaya industry for many years; however, Kapoho is susceptible to PRV. Yields of Rainbow are higher during the first year of harvest compared to the Kapoho variety. In the second year of harvest, yields for Rainbow are comparable to the Kapoho variety. Routine field inspections and rogueing of infected trees kept losses to PRV light. The Kapoho variety comprised 25 percent of total acreage compared to 30 percent the previous year. Annual August surveys since year 2000 show Rainbow and Kapoho have been the major two varieties.

The State’s in crop papaya acreage totaled 2,095 down 13 percent from the previous year. Harvested acreage rose 3 percent from 2005 to 1,530 acres, up for the second year.

In 2006, the number of farms totaled 168, declining 19 percent from the 2005.

Hawaii County continues to lead with papaya production and accounting for the majority of the State’s total.

Value of utilization (fresh and processed) for 2006 was pegged at $11.0 million, 2 percent below 2005. Papaya price of 38.5 cents per pound increased 4.3 cents above last year average.

U.S. Papaya Imports Higher

Fresh papaya imports from foreign sources into the United States totaled 291.4 million pounds in 2006, up 14 percent from the previous year, according to the Department of Commerce. Mexico accounted for 201.0 million pounds or 69 percent of the total. Imports from Belize have steadily increased and contributed 26 percent of the total imports in 2006.

Total imports by type for 2006 increased 14 percent from 2005 to 308.6 million pounds due to more fresh papayas. Fresh imports continued to account for the majority or 94 percent of total imports.

World Papaya Production Up 2 Percent

World papaya production totaled 14.9 billion pounds in 2006, up 2 percent from a year ago, according to the Food and Agriculture Organization.

Brazil remained the top producer of papayas growing 3.5 billion pounds. Rounding out the top five producers world wide are Nigeria with 1.8 billion pounds, Mexico with 1.8 billion pounds, India with 1.7 billion pounds, and Indonesia with 1.4 billion pounds.

Hawaii Monthly Livestock Review

Here is the PDF file for the *Hawaii Monthly Livestock Review *Report.

lvstk080907.pdf

Please visit the website for more information: http://www.nass.usda.gov/hi/

————————————————————-
Contact Information:
Mark E. Hudson, Director
USDA NASS Hawaii Field Office
1421 South King Street
Honolulu, HI 96814-2512

Office: (808) 973-9588 / (800) 804-9514
Fax: (808) 973-2909
————————————————————-

“HAWAII MONTHLY LIVESTOCK REVIEW” reports are available on our website http://www.nass.usda.gov/hi/ and also PRINTED monthly. Subscriptions for PRINTED copies are free to those persons who report agricultural data to NASS (upon request) and available for $4 per year to all others.

Hawaii Monthly Livestock Review

June Egg Production Down 16 Percent From A Year Ago

Hawaii egg production totaled 6.9 million (19,167 cases) in June 2007, down 16 percent from June 2006. The average number of layers on hand during June 2007 was estimated at 368,000, up fractionally from May 2007 and down 17 percent from June 2006. The average rate of lay during June 2007 was 1,875 per 100 layers (62.5 percent rate of lay), up 2 percent from June 2006.

Total Cattle Marketings and Exports

June Cattle Marketings Down 30 Percent From 2006

Total cattle marketings for June 2007 is estimated at 4,000 head, down 30 percent from June 2006. Cumulative cattle marketings for the first six months of 2007 totaled 27,900 head, down 7 percent from the same period a year ago.

Exports down 38 percent from year ago

Exports of steers and heifers totaled 3,000 head in June 2007, down 38 percent from a year ago. Exports of steers totaled 1,800 head during June 2007, down 33 percent compared to a year ago. Total export of heifers also declined in June 2007 compared to a year ago at 1,200 head, a 43 percent decrease. Cumulative exports of steers and heifers through June 2007 totaled 22,500 head, down 9 percent from the same period a year ago. Cumulative exports of steers for 2007 stands at 13,300 head, down 7 percent from 2006. Exports of heifers showed a larger decrease through the first six months of 2007 at 9,200 head or down 12 percent from a year ago. Exports of other classes of cattle were not included.

Hawaii Papayas Report

Here is the PDF file for the Hawaii Papayas Report.

papaya072307.pdf

Please visit the website for more information: http://www.nass.usda.gov/hi/

————————————————————-
Contact Information:
Mark E. Hudson, Director
USDA NASS Hawaii Field Office
1421 South King Street
Honolulu, HI 96814-2512

Office: (808) 973-9588 / (800) 804-9514
Fax: (808) 973-2909
————————————————————-
HAWAII PAPAYAS” reports are available on our website and also PRINTED monthly. Subscriptions for PRINTED copies are free to those persons who report agricultural data to NASS (upon request) and available for $4 per year to all others.

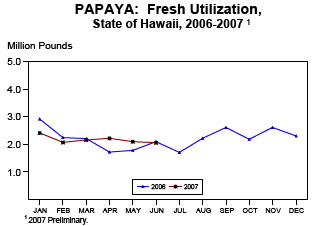
JUNE FRESH PAPAYA OUTPUT LOWER

Hawaii fresh papaya utilization is estimated at 2.1 million pounds for June 2007, 2 percent lower than May 2007 and June 2006. Output for the first half of the year totaled 13.0 million pounds, slightly higher than the same period last year.

Total in crop for June is estimated at 1,735, down 10 percent from March 2007 and 1 percent less than June 2006. Bearing acreage totaled 800 acres, 8 percent below March of this year and declining 47 percent from June of last year. Bearing acreage should increase as new acreage comes into production late summer or early fall.

June weather conditions continued warm and sunny with occasional showers. More rain would be beneficial towards growth and fruit development. Clear weather assisted in field operations and usual orchard maintenance.

Papaya growers are expected to receive an estimated 52.0 cents per pound for fresh fruit in June, 6 percent (3.0 cents) higher than May and 10 percent (4.9 cents) more than last June.

Hawaii Macadamia Nuts (Final Season Estimates)

Here is the PDF file for the *Hawaii Macadamia Nuts (Final Season Estimates)* Report.

mac-fin071307.pdf

Please visit the website for more information: http://www.nass.usda.gov/hi/

————————————————————-
Contact Information:
Mark E. Hudson, Director
USDA NASS Hawaii Field Office
1421 South King Street
Honolulu, HI 96814-2512

Office: (808) 973-9588 / (800) 804-9514
Fax: (808) 973-2909
————————————————————-

“HAWAII MACADAMIA NUTS” reports are available on our website and also PRINTED twice a year. Subscriptions for PRINTED copies are free to those persons who report agricultural data to NASS (upon request) and available for $2 per year to all others.

Final Season Estimates Higher For 2006-2007 Crop Year
Hawaii?s 2006-07 end-of-season macadamia nut harvest is estimated at 58.0 million pounds net, wet-in-shell, up 4.0 million pounds from last season?s harvest, according to USDA, NASSHawaii Field Office. While not the highest on record, this season?s output matches the previous high set back during the 1997-98 crop year.

Weather for 2006 was mixed. Approximately six weeks of rainfall from late February thru March occurred statewide. For some macadamia nut orchards located in normally drier areas, the rainfall was welcome. However, macadamia nut orchards located in normally wet areas suffered lower output due to disease problems.

Early in the season, one large processor announced it would limit nut purchases from independent growers. Many growers have reported that the lack of an outlet to sell their nuts has been a problem and with lower nut prices, the crop has not been harvested by some growers. Some farmers have reportedly gone into other commodities due to the low prices being paid and the lack of an outlet to sell their nuts. Growers have also related that feral pigs were a problem in some areas. The feral pig problem has increased in some areas; probably due to growers leaving nuts on the ground and providing a food source for pigs which increased survival of offspring, lending itself to more pigs foraging for food.

Crop losses were estimated at 11.0 million pounds or 17 percent of the total crop. Immature nuts ranked as the highest cause of losses at nearly 38 percent followed by koa seed worm damage and moldy or rotten nut losses with 19 percent and 17 percent, respectively. Overall yields averaged 3,867 pounds per acre (net, wet-in-shell), 29 percent higher than the 2005-06 crop year.

Total acreage for 2006-07 decreased 1,300 acres to 17,000 acres while harvested area totaled 15,000 acres, a 3,000 acre decline from last season. The farm price for net, wet in-shell macadamia nuts averaged 67.0 cents per pound, 14.0 cents less than the 2005-06 average.

Crop Losses Measured By Processors Lower

Growers delivered an estimated 65.0 million pounds of macadamia nuts, wet-in-shell, to processors during the 2006-07 season. About 11 percent of the harvest was culled, resulting in 58.0 million pounds net, wet in-shell. The equivalent gross weight of losses, after adjusting for what would be the expected weight before the damage, was 11.0 million pounds, 11 percent less than last season?s revised estimates. Losses from nut immaturity ranked at the top with just under 38 percent of the total losses. Koa seed worm damage was the second most common type of loss at 19 percent, followed by losses from moldy or rotten nuts at 17 percent. Macadamia nut losses shown in this report include only those culled by processors and do not include losses that were culled at the farm before delivery.

U.S Nut Production Up 9 Percent, Value Down 17 Percent

The 2006 U.S nut production is estimated at 1.59 million tons (in-shell basis), 9 percent greater than a year earlier. The almond crop is 953,000 tons, up 23 percent from 2005. Walnut production in 2006, at 346,000 tons, is down 3 percent from the previous year. The pistachio crop is 119,000 tons, 16 percent smaller than 2005. Pecan production in 2006 totals 103,150 tons, a 26 percent drop from 2005. The hazelnut crop, at 43,000 tons, is 56 percent larger than the previous year. Macadamia production is 29,000 tons, up 7 percent.

The 2006 U.S. value of utilized nut production is estimated at 3.45 billion dollars, down 17 percent from the 2005 value. The almond crop is valued at 2.04 billion dollars, 19 percent less than 2005. Walnuts are valued at 554 million dollars, 1 percent less than 2005. Pistachio value for 2006, at 455 million dollars, is 22 percent less than last year. The value of the pecan crop decreased 21 percent to 321 million dollars. Hazelnut value, at 46.4 million dollars, is 25 percent below last year. The macadamia crop is valued at 38.9 million dollars, down 11 percent.

Hawaii Monthly Livestock Review

Here is the PDF file for the *Hawaii Monthly Livestock Review* Report.

lvstk071207.pdf

Please visit the website for more information: http://www.nass.usda.gov/hi/

————————————————————-
Contact Information:
Mark E. Hudson, Director
USDA NASS Hawaii Field Office
1421 South King Street
Honolulu, HI 96814-2512

Office: (808) 973-9588 / (800) 804-9514
Fax: (808) 973-2909
————————————————————-

HAWAII MONTHLY LIVESTOCK REVIEW” reports are available on our website http://www.nass.usda.gov/hi/ and also PRINTED monthly. Subscriptions for PRINTED copies are free to those persons who report agricultural data to NASS (upon request) and available for $4 per year to all others.

May Egg Production Down 17 Percent From A Year Ago
Hawaii egg production totaled 6.9 million (19,167 cases) in May 2007, down 17 percent from May 2006. The average number of layers on hand during May 2007 was estimated at 367,000, down 3 percent from April 2007 and down 18 percent from May 2006. The average rate of lay during May 2007 was 1,880 per 100 layers (60.6 percent rate of lay), up 1 percent from May 2006

May Cattle Marketings Up 10 Percent From 2006
Total cattle marketings for May 2007 is estimated at 7,500 head, up 10 percent from May 2006. Cumulative cattle marketings for 2007 through May totaled 24,000 head, down 1 percent from the same period a year ago.

May exports up 12 percent from year ago
Exports of steers and heifers totaled 6,500 head in May 2007, up 12 percent from a year ago. Exports of steers totaled 3,900 head during May 2007, 3 percent higher than a year ago. Total export of heifers was also higher in May 2007 compared to a year ago at 2,600 head, a 30 percent increase. Cumulative exports for 2007 totaled 19,500 head of steers and heifers through May, down 2 percent from the same period a year ago. Cumulative exports of steers for 2007 stands at 11,500 head, down 1 percent from 2006. Exports of heifers showed a larger decrease through the first five months of 2007 at 8,000 head or down 4 percent from a year ago. Exports of other classes of cattle were not included.

Average live weight up 2 percent
The average live weight of steers and heifers exported from Hawaii in May 2007 was 418 pounds, up 2 percent from May 2006?s average live weight of 412 pounds.

Commercial Beef Production Up 5 Percent
Hawaii commercial beef production (local slaughter) during May 2007 totaled 582,000 pounds, up 5 percent from May 2006. Cumulative beef production (local slaughter) through May 2007 totaled 2.6 million pounds, up 7 percent from a year ago. Commercial kill totaled 1,000 head in May, unchanged from May 2006. Average live weight per head was 1,085 pounds in May 2007, up 6 percent from the average live weight per head in May 2006.

Commercial Pork Production Down 5 Percent
Hawaii commercial pork production during May 2007 totaled 316,000 pounds, down 5 percent from May 2006. Cumulative pork production for the first five months of 2007 totaled 1.4 million pounds, down 7 percent from a year ago. Total hog kill was 1,900 head in May 2007, down 5 percent from a year ago. Average live weight per head was 219 pounds in May 2007, down 4 percent from the 227-pound average a year ago.

May Milk Production Down 35 Percent From Year Ago
Hawaii?s dairy cows produced 3.3 million pounds of milk in May 2007, down 35 percent from a year ago. Cumulative milk production for the first five months of 2007 totaled 18.9 million pounds, down 25 percent from the same period in 2006.

May?s Cow Herd Down 26 Percent From Year Ago
Hawaii?s cow herd, both dry and milking, numbered 3,200 head in May 2007, unchanged from April 2007 but down 26 percent from May 2006. Average milk per cow is estimated at 1,020 pounds for May 2007, down 14 percent from last May?s average of 1,185 pounds per cow.

Average Farm Prices

Most Livestock Prices Remain Higher Than Year-ago Averages

Steers and heifers
The average dress weight farm price for steers and heifers is estimated at 99.0 cents per pound for May 2007, down 1 percent from April 2007 but unchanged compared to a year ago.

Cows
The average dress weight farm price for cows is estimated at 55.0 cents per pound in May 2007, up 2 percent from April. Compared to a year ago, the average dress weight farm price for cows was up a penny from May 2006.

Market hogs
The average dress weight farm price for market hogs is estimated at $1.17 per pound for May 2007, down 2 percent from April 2007. Compared to a year ago, the dressed weight for market hogs was down 8 percent this May.

Milk
The average farm price for milk was $27.40 per hundredweight during May 2007, up 1 percent from April 2007. Compared to a year ago, the May 2007 average farm price for milk was 10 percent higher.

Eggs
The average farm price for a dozen eggs was $1.12 in May 2007, up 2 percent from April 2007 and 14 percent higher than a year ago.

Hawaii Papayas Report

Here is the PDF file for the Hawaii Papayas Report.
papaya062007.pdf

Please visit the website for more information: http://www.nass.usda.gov/hi/

————————————————————-
Contact Information:
Mark E. Hudson, Director
USDA NASS Hawaii Field Office
1421 South King Street
Honolulu, HI 96814-2512

Office: (808) 973-9588 / (800) 804-9514
Fax: (808) 973-2909
————————————————————-

“HAWAII PAPAYAS” reports are available on our website http://www.nass.usda.gov/hi/ and also PRINTED monthly. Subscriptions for PRINTED copies are free to those persons who report agricultural data to NASS (upon request) and available for $4 per year to all others.

MAY FRESH PAPAYA UP FROM LAST YEAR

Hawaii fresh papaya utilization is estimated at 2.1 million pounds for May 2007, down 6 percent from April 2007, but up 18 percent from May 2006. Year-to-date utilization at 11.0 million pounds was 1 percent above the same period last year.

Sunny and dry conditions prevailed in May. Orchards benefited from warm temperatures and longer day lengths. Irrigation was stepped up to replenish low soil moisture levels. Orchards with irrigation made good progress. Fields depending upon natural rainfall, especially plantings grown in porous rocky conditions, experienced slower growth and fruit development. Fungus outbreaks were limited with drier weather. Insects, papaya ringspot virus, and wild pig damage remained concerns for some growers.

Papaya growers are expected to receive an estimated 49.0 cents per pound for fresh fruit in May, 2 percent (1.0 cent) higher than April, but 16 percent lower than (9.0 cents) May a year ago.

Hawaii Guavas Report.

Here is the PDF file for the annual Hawaii Guavas Report.
guava061907.pdf

Please visit the website for more information: http://www.nass.usda.gov/hi/

————————————————————-
Contact Information:
Mark E. Hudson, Director
USDA NASS Hawaii Field Office
1421 South King Street
Honolulu, HI 96814-2512

Office: (808) 973-9588 / (800) 804-9514
Fax: (808) 973-2909
————————————————————-

“HAWAII Guavas” reports are available on our website and also PRINTED annually. Subscriptions for PRINTED copies are free to those persons who report agricultural data to NASS (upon request) and available for $2 per year to all others.

2006 GUAVA OUTPUT LOWER

HAWAII?S 2006 UTILIZED GUAVA PRODUCTION WAS PEGGED AT 7.4 MILLION POUNDS, 9 percent lower than 2005, according to USDA, NASS, Hawaii Field Office. Weather conditions were mixed for guava production during 2006. Six weeks of heavy rainfall from late February thru March resulted in slow fruit maturation in many orchards. Field operations were curtailed during the wet weather.

ACREAGE DEVOTED TO GUAVA PRODUCTION TOTALED 575 ACRES, 14 percent less than the previous year. Harvested area was estimated at 365 acres, 41 percent fewer than 2005. The average farm price for fruit utilized mainly for processing was estimated at 14.2 cents per pound, 2 percent (0.3 cent) more than the previous year. Statewide farm value totaled $1.1 million, 7 percent lower than 2005.

U.S. IMPORTS OF SELECTED GUAVA PRODUCTS IN 2006 were mixed from a year ago (see page 4). Guava paste and puree were down 19 percent to 7.7 million pounds (3,514 metric tons). Brazil, accounted for nearly 44 percent of the paste and puree imports.

Prepared or preserved guava imports increased 5 percent from the previous year to 14 million pounds (6,346 metric tons). Ecuador and Dominican Republic supplied over 50 percent of these imports into the U.S.

Imports of guava jam were up 13 percent to 2.0 million pounds (913 metric tons). Costa Rica and Brazil accounted for 79 percent of the guava jam total.